Posts

Alicon Castalloy

Image
Twitted on 15th Feb 2016 and  below is that embed. ALICON (252) - Last Friday double bottomed out at 236+ (Low equity and decent P&L account & Balance Sheet company) pic.twitter.com/KT2wU2Tt8E — Murugavel (@murugavell) February 15, 2016 The current chart is 
Image

TRADING TERMINAL SCREENSAVER

Image

USA - DOWJONES

Image
Dow Jones Industrial Average (^DJI) -17481)  After Jan and Feb. 2016 fall,  up move started  in  mid Feb.  and for this,   trend completion levels is 17520  yesterday it made high 17529.  *** So now it seems topped out  or topping out very soon (few more points)  and down move going to start... *** this is come under "tell the story after the see the picture"

MANAPPURAM FINANCE

Image
MANAPPURAM (35.45) -  In Jan & Feb 2016 market meltdown. several stocks crashed 20 % to 70% from their high in this crash, But few stocks not panicked and  this is one among them even in this price dividend yield comes around 5%

Vinati Organics Ltd.

Image
VINATIORGA (408)  Business-wise, it is a very strong company 10 Yrs ROE 30+% and now trading at 16 PE.    Established in 1989, Vinati Organics Ltd. is a specialty chemical company producing aromatics, monomers, polymers and other specialty products. Today, the company is a leader in its field and has a sturdy market presence in over 22 countries.  The company started operations in its first plant in Mahad in 1992, with its focus on Isobutyl Benzene (IBB). A decade later, in 2002, it started commercial production in its second plant in Lote Parshuram, producing 2-acrylamido-2-methylpropane Sulphonic acid. VOL has remarkably enhanced the scope of its facilities and now also produces organic intermediates and aromatics. IBB, a specialty organic  intermediary, is used as a raw material for the manufacture of Ibuprofen, an anti-inflammatory analgesic bulk drug. VOL has achieved a record...
Image

"An unprecedented opportunity for transformation" : IMF chief Christine Lagarde

Image
Appreciating continuing reform process in the country, IMF chief Christine Lagarde on Saturday said “India’s star shines bright” amid global economic challenges and can deliver nearly two-thirds of the worldwide growth over the next four years despite a slowing momentum. The world’s fastest-growing large economy, she said, is on the verge of having the largest and youngest-ever workforce and, in a decade, set to become the world’s most populous country. “So, India stands at a crucial moment in its history — with an unprecedented opportunity for transformation . Important reforms are already under way,” the IMF managing director said at a conference on ‘Advancing Asia: Investing for the Future’ here. “Think, for example, of Make-in-India and Digital India. And with the promise of even more reforms to come, India’s star shines bright.” “Over the next four years, even with a slightly declining momentum, it stands to deliver nearly two-thirds of global growth,” she added...

Dishman Pharmaceuticals and Chemicals

Image
UNDERSTAND THE UNDERCURRENT

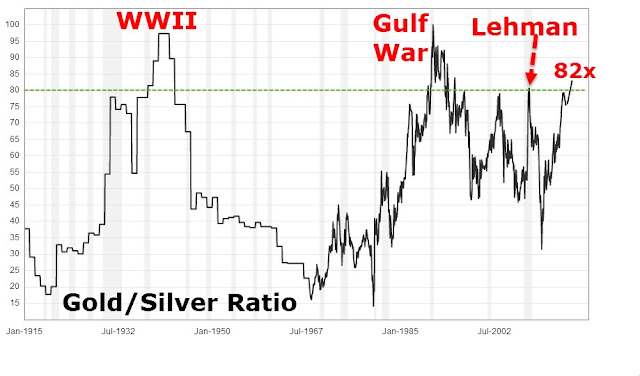
GOLD : SILVER ratio

Image
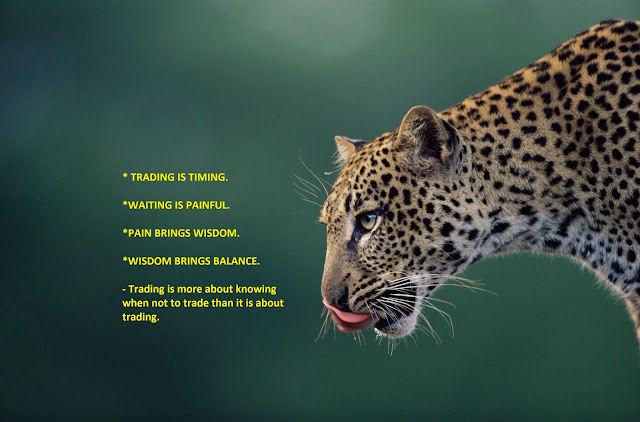
Market is not Bull & Bear alone but beyond that... This LEOPARD 's action is one more learning.  Observe  &  Act  
Image
"Some one said"

BRAZIL vs INDIA

Image
Comparison of BRAZIL and INDIA price movements are just en-lighting   the TRENDS. Listen the TREND and not listen the so called intellectual and fund managers views.  (because they may go wrong most the times, but the TREND is always indicate the real picture.). BRAZIL  62 Months DOWN TREND Down by 49 % INDIA - 12 Months DOWN TREND Down by 25 % **** BRAZIL -  28 Days UP TREND  Up by 28 % INDIA - 4 Day  UP TREND Up by 10 %

NIFTY

Image
NIFTY (7222) - Chart of NIFTY was posted on 15th Jan  with marking. (that time it was trading at 7500+.) Once again i repeat the same chart with same marking and now it includes  the Budget day low. *** NIFTY 2011-2016 **** NIFTY 2008-2016 ***** After gone through the above two charts, any body can understand the importance of 6800+. Can come to a conclusion that  completed the first leg of rally top of 9119 and its correction bottom of 6825.  ****** Now it is time to start the second leg of upward rally but it is very long time consuming process. (lot of consolidation , congestion, grinding and little bit of volatility will be part of the process) ******* In case if it close below 6800, then we will look the next downside pan out until then forget the down side other than 6800+ bottom.

Arvind

Image
A RVIND (239) - See the post dated 04th Feb, now closed below the mentioned down side target now what next ?  Last hope and Support 220--210 but below that Ultimate downside targets  110-100 & 70--60

Saregama India

Image
SAREGAMA  ( now time is  10.45 A.M. and now trading at 211 after made low 185.10) -  Posted on 15th Jan 2016 as " Hope and support 330-300 But trade and stays below that  Ultimate Downside Target 192--182" After this post, it broken the support of  330-300 on the posted date itself (that is on 15th Jan) that day it closed at 291.05 and after that it gave pull back and went up to 317 on 01st Feb. ,from their, fall started and  today , intra day it made low 185.10 and now trading at 211. so target attacked precisely. *** now what next ?  If hold 192--182 then the pull back target  250--265 & 300--330 *** Below chart explain even better Click the chart to get the zoom view

HSIL

Image
HSIL (228) - Below 235 weak only Hope and support 220-240 But below that  Down side Target 157--137

Garware Wall Ropes Limited

Image
GARWALLROP (288) - Already posted on 03rd Nov. and this is reminder only. SUPPORT 260--230 TARGET  480-500

Indiabulls Housing Finance

Image
IBULHSGFIN (583) - Support 584-572  and last hope & support 553-543 But below that down side target 425-410

Hindustan Petroleum Corporation

Image
HINDPETRO (677) Any pull back,  face resistance 745--765 down side support exists at 565--545

Hero MotoCorp

Image
HEROMOTOCO (2702) Last post was on 23rd Nov. 2015 and said down side target 2385-2365 , as posted it came down up to 2377 in Jan 2016 and now trading at 2702. In the last 10 months, consolidation is going on and now any time, it may going to come out of this consolidation. Resistance 2735-2835  above that  3250-3350 But above that  ULTIMATE UPSIDE TARGET 4250-4350

Amara Raja Batteries

Image
AMARAJABAT (890) -  Tweeted on 02nd Nov. 2015.  the following is that embed :  AMARAJABAT (892) - Hope & Support 890--870 But below that down side target 795-775 & 705-685 pic.twitter.com/F4OqTmAkkZ — Murugavel (@murugavell) November 2, 2015 After this tweet, it broken 890-870 in Nov. 2015 itself and in Jan 2016 it came down to the mentioned down side target of 795-775 (low was 774 on 18th Jan 2016), not only that, from their it bounce backed and now  trading at 890. now what next ?  Face Resistance 900-920 But above that upside Target 1035--1065 *** Already mentioned support of  775 remain same But stays below 785-765  ULTIMATE  DOWN SIDE TARGET 435--415

Info Edge (India)

Image
NAUKRI (730) -  The company name may be INFO EDGE ,but now,  it is trading at lower edge of  15 months consolidation. So Last hope and Support 710--690 If hold ,  then the upside target 880--910   &  980 --1020 *** But below 710--690 take it down to  505---455

NIFTY IT INDEX

Image
Nifty IT (10769) -  This month showed its weakness in macro point of view. Last hope and support 10700--10600 Either one monthly or two continuous weekly or  six continuous daily close below that gives confirmation for a big down fall  that take it down to 8650--8450

NIFTY

Image
DOUBLE DIGIT PERCENTAGE MOVE  since 1998.

Motherson Sumi Systems

Image
MOTHERSUMI (227) -  SUPPORT 217--197 But below that  next support 130--110

Tata Communications

Image
TATACOMM (352.75) - Last hope and Support 350--330 But below that  Ultimate Downside Target   209--197 with in between support at 260--250

Tata Global Beverages

Image
TATAGLOBAL (102.65) - Posted on 25th Aug. 2015 as " Last hope and support 112-108 But below that  ULTIMATE DOWN SIDE TARGET 67-65 with in between support at  81-79" After this post,. on the posted date itself, it took support at the mentioned support level of 112-108 (that day low was 108.55,) from their it went up to 149.80 on 06th Jan., and correction started and in the last four days it traded and closed below that mentioned last hope and support of 112-108. *** Now what is in ?  Resistance 108--112  below that  ULTIMATE DOWN SIDE TARGET 67-65 with in between support at  81-79 *** Below chart explain even better (click the chart to get the zoom view)