Posts

Showing posts from July, 2016

Record Created among all the NSE listed, in the last 10 Months.

Image

F vs D

Image
In contrast to declining FPI ownership in Indian equities, the share of domestic institutional investors (DIIs) investment has surged to a record high of 10% ( Rs. 8.81 trillion). The rise is largely an indication of the rising interest of retail investors toward equity in the recent past, data showed.

APPLE iPHONE Journey from 2007 to 2016

Image

ALL DATA - MONTHLY - F&O STOCK - PROMOTOR FULL CONTROL - NEW ZONE ENTERING PHASE

Image

JUST DIAL and CRISIL IPO grade report !!!

Image
JUST DIAL came out IPO  @ 530 in 2013 and listed on 05th June 2013  after three years now trading at 530. that means zero % return after holding more than  3 years *** CRISIL gave IPO Grade 5/5 (STRONG) for JUSTDIAL below is their report link :  https://www.crisil.com/Ratings/Brochureware/News/CRISIL-Research_ipo-grading-rat_just-dial-2013.pdf ------------ CRISIL is Rs.15000 Cr. Market Cap Company and quoting at 46 P/E Market Cap to Sales: 9.80 Balance sheet total:  1,333.12 Cr. **** CRISIL was/is a valued company  but  Was any value in their report of JUSTDIAL ? 

BHARATFIN Vs FEDERALBNK

Image
Vs Both are in finance business but in different journal.  Which market cap going  to expand fast & sustain ?  Market Sense or Common Sense Use whatever have. ***

REVERSE "SET SQUARE"

Image
ONE STOCK* forming a classical   "REVERSE SET SQUARE" break out pattern. Once it come out it , then very shortly going to give return of   30% .  (but this 30% equal to almost 200 %,  why ?, that will explain,once it reach its target) CAN YOU FIND OUT ?  --------------------------------------- * purposely erased the name and price in the chart.

Latest Article : Indian sugar mill group sees no cause for concern as stocks slide

Image
Indian sugar stockpiles will fall to their lowest in over a decade next year as consumption outstrips supply, but will still be sufficient for the world's top sugar consumer, India's sugar millers said on Friday. Drought in the past two years in India and in the world's second-largest sugar producer Thailand has shrivelled sugar cane and cut supply. International sugar futures reach a near four-year high in late June. Indian output in the 2016-2017 crop year should fall to around 23.3 million tonnes, down from 25.1 million tonnes the year earlier due to the drought, said Indian Sugar Mills Association President Tarun Sawhney in an interview with Reuters in Bangkok on Friday. With consumption at 26 million tonnes, India would draw down around 2.7 million tonnes from stocks to leave them at 4.3 million tonnes at the end of the 2016-2017 crop year, Sawhney said.That was around two months of consumption, the lowest since 2005, and a level lower than India ha

11 Months before article : Sugar loses its sweetness as stockpiles reach record highs

Image
Sugar, once one of the sweetest areas of the commodities sector, is now turning bitter. Prices have hit a seven-year low as key drivers for the commodity, which can be used either to sweeten food or to produce ethanol biofuel, have gone into reverse. Such is the state of the sugar cane market that local media in India have reported a rise in the number of sugar cane farmers committing suicide in the country’s main cane-producing belt because processing mills are refusing to pay producers pre-agreed prices. Globally, sugar prices are trading at around 10.6 cents per pound. Despite farmers cutting back production and bad weather adversely affecting harvests in some areas, the market is expected to remain in surplus into next year. This is happening even though food manufacturers are using more sugar to make products such as lemonade, ketchup and chocolate, according to Commerzbank research. However, the International Sugar Organization (ISO) published new forec

Pricol Limited

Image
PRICOL  - GOOD GOING...

Shilpi Cable Technologies Limited

Image
SHILPI - GOOD GOING....

Sarda Energy & Minerals Limited

Image
SARDAEN - GOOD GOING...

ARSS Infrastructure Projects Limited

Image
ARSSINFRA - GOOD GOING...

Escorts Limited

Image
ESCORTS - GOOD GOING...

Thirumalai Chemicals Limited

Image
TIRUMALCHM - GOOD GOING....

Chemfab Alkalis Limited

Image
CHEMFALKAL - GOOD GOING...

TOP GAINERS - TRAILING TWELVE MONTHS.

Image
In the Trailing Twelve Months,  160 stocks gained 100 %  and above and  Top Gainer is UPERGANGES,gained 12 times. Be Proud, Because,  Out of Top 30, discovered and used 7, Which includes UPERGANGES to KAKATCEM  In Gained order   In Alphabet order STOCK                % GAIN STOCK                 % GAIN UPERGANGES 1173.66% 8KMILES 172.57% DWARKESH 1058.71% A2ZINFRA 218.08% ALLSEC 949.27% ALLSEC 949.27% MAWANASUG 912.95% ALPA 150.00% STOREONE 808.12% AMTL 108.21% UTTAMSUGAR 718.18% ANDHRSUGAR 192.95% DALMIASUG 715.60% APLAPOLLO 134.76% RUSHIL 714.35% ARSSINFRA 273.46% OUDHSUG 659.50% ASHIMASYN 113.45% UGARSUGAR 576.92% ASTEC 105.34% RANASUG 528.00% BALAMINES 147.49% EMMBI 488.63% BALRAMCHIN 217.21%

MANAPPURAM FINANCE

Image
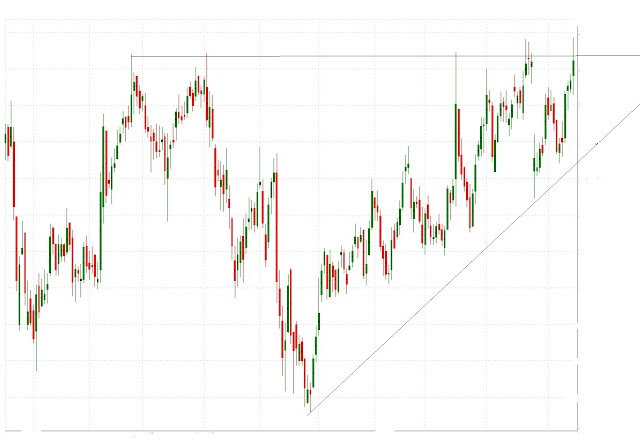
MANAPPURAM  (76.20) -  On 18th March Posted , when it was trading at 35 and said as  "In Jan & Feb 2016 market meltdown. several stocks crashed 20 % to 70% from their high in this crash, But few stocks not panicked and  this is one among them even in this price dividend yield comes around 5% " *** After the above post, it came down to 33.70 on 28th March and last Monday, that is on 04th July ,  it made high 81.70. That means, It gave absolute return of 142% in less than 4 months.   Lot more happened, in several stocks,  during this 4 months, which were discovered & used.   but not posted here. Journey continue... *** Can understand in the below chart,  how it was moved up. (click the chart to get the zoom view) 

World Markets Update: Amazing, Post-Brexit Relief Rally

Image
     The global relief rally following the Brexit selloff has been truly amazing. Over the past week the UK's FTSE soared 7.15%, the largest weekly gain of 2016 posted by any of the eight indexes on our world watch list. The other seven indexes logged weekly gains ranging from Germany's DAXK at 2.24% to Japan's Nikkei at 4.89%. A Closer Look at the Last Four Weeks The tables below provide a concise overview of performance comparisons over the past four weeks for these eight major indexes. We've also included the average for each week so that we can evaluate the performance of a specific index relative to the overall mean and better understand weekly volatility. The colors for each index name help us visualize the comparative performance over time. . Year-to-Date Performance Here is an overlay of the eight illustrating their comparative performance so far in 2016. Note the huge bounce, which reflects the post-Brexit vote relief rally.