Posts

Last 10 years interest in the IPO

Image

RELIANCE ? Even after 3 decades, Old habits never die.

Image
Market regulator Securities and Exchange Board of India has imposed a Rs 1,000-crore penalty on Reliance Industries Ltd., the largest in its over 20-year history. In a case dating back to 2007, SEBI has found Reliance Industries and 12 related entities guilty of fraudulent and manipulative trades. The SEBI order, published on its website on March 24, 2017, says Reliance Industries and the 12 other entities violated provisions of Section 12A of the SEBI Act, 1992 and SEBI (Prohibition of Fraudulent and Unfair Trade Practices relating to the securities market) Regulations, 2003. The regulator has prohibited the 13 entities, including Reliance Industries, ā€œfrom dealing in equity derivatives in the F&O segment of the stock exchange, directly or indirectly for a period of one yearā€, from the date of the order. The regulator has also directed Reliance Industries to, ā€œto disgorge an amount of Rs 447.27 crore...along with interest calculated at the rate of 12 perce...
A rare meeting

Image
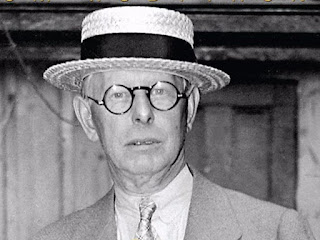
 Benjamin Graham & Jesse Livermore met recently and both were satisfied with a stock in their respective criteria.    *** Below is the chart of that stock (name and price purposely erased) 

RAYMOND

Image
RAYMOND (656) -  Brought to this place after 10 years.  Ought to be double before 10 months.  Unwritten  Rule. *** Hint was given, already, last year itself,  not one time but two times Post dated 20th Sept. 2016:        A fabric symphony and  post dated 20th Oct. 2016:   Made to Measure

WALMART vs DMART

Image

INDIA and Rest of the World

Image
Now We are in the 7th Position  but the status of the Third position is striking distance only. That is not enough,  The aim, be First, even it may be little longer.  We Can & We Will. *** Top Twenty

FOLLY GAMES - ENERGYDEV

Image

NIFTY - Mega & Mini

Image
NIFTY (9085)- What was panned out between 2008---2014  can be called  as MEGA When it came "Out of the box" after 6 Years - yielded  3000 points  What is panning out between 2015-2017   can be called as MINI In case, if it comes "Out of the box" after 2 years - may yield 1500 points.

FOLLY GAMES - SUNILHITEC

Image

FOLLY GAMES - MAHASTEEL

Image

USD/INR

Image

BOVESPA vs SENSEX

Image
BOVESPA BRAZIL - YEAR CHART SENSEX INDIA - YEAR CHART 

ESCORTS - more than 350 % in less than 14 months.

Image
ESCORTS (509.65) - Posted on 28th Aug. 2015, when it was at 171,  Said  SUPPORT  110--100 and  said ULTIMATE UPSIDE TARGET 510--530 Click Here to see that post.  *** After this post, it came down to 112.80  on 12th Feb 2016 and  yesterday, 10th March 2017 made high 517.70. That means more than 350 % absolute return within 14 months.  This was one of the rare ones as per my study of  PRICE,PATTERN, VOLUME & VALUE and worked out well.  ---- Now, climax & finishing touch stage.  What next?  that was also answered in my Twitter  dated 05th March 2017. ESCORTS - Enterprise Value 4 K Cr & present Mar.Cap 6 K Cr. My perception : Won't go beyond a billion $ Mar.Cap. in the present context. — Murugavel (@murugavell) March 5, 2017 ---- Can see it,  in the below monthly chart. 

BEST & REST

Image

RABITS vs TORTOISE

Image
  Four stocks (ARVIND,ESCORTS,TVSMOTOR &VOLTAS). had broken out in the same period (between 2013 last quarter to 2014 first quarter)  and almost same price (between 85--95) . At that time of 2014 beginning, I had a conviction  that all the four will reach sub 500 in the medium term perspective After 3 years, now this is the period to learn a lesson from the above presumption, Out of four, three stocks moved rabbit like move but not able to reach the sub 500 level till now.   B ut ESCORTS moved  like tortoise and now at sub 500 level.  So the lesson is whoever moved fast at the beginning, they may become tired in the middle of the journey itself  before reaching the expected  destination .

NIFTY 50 vs NIFTY 100,200 & 500

Image
In Feb. 2017 month, NIFTY 100, NIFTY 200 & NIFTY 500 all the three closed on the month basis above the 2015 March high, only exception NIFTY 50

NIFTY - revisit & review

Image
NIFTY (8900) -  Said on post dated 01st Jan 2017,  "In this year of 2017, the range will be between 7200-6800  in downside and  8600-9000 in the upside.Probably both end we will see in 2017.In case if it violates either one of the above then we may relook the present set up until then this will be the broad range. " So, as per the above view, this year upside range 8600---9000,  yesterday high 8992  and closed at 8900.  that means,now the upside range fully completed and apart from it,  got some more signals & waiting few more  that don't want to elaborate here.  it seems, as such, Topped out @ 8992. *** As long as stays between 8600-9000, considering as topping range. But in case , break above this range then  9000-9200 will become  || neutral || make or break || to be or not to be || But above that  next in upside 10400  and afterwards 1...

DJI 30 vs NIFTY 50

Image
DJI 30  now near to mature between 21300+ to 21900+   Cause & Effect of  break out of both 2008 High & 2015 High NIFTY 50  When will it start its journey towards to  mature?  now  9100+ crucial. "break out" - to be or not to be

A mail from a share holder to the management of INFOSYS

 Name : XXXXXXXXXXX  [Pan: xxxxxxxxxx] CDSL ClientID: xxxxxxxxxxxxxxxx  xxxxxx To, Ranganath D. Mavinakere Chief Financial Officer INFOSYS. Sandeep Mahindroo Financial Controller and Head – Investor Relations INFOSYS. AGS Manikantha Company Secretary INFOSYS. Dear Sir,  I am holding 100 shares of INFOSYS in the above demat account; so I am a shareholder of INFOSYS. There are so many talks in the media, after the Rs.16000 Cr buyback announcement from TCS and there are so many circulating stories or reports of uncertain or doubtful truths, and speculations in the media that our company (INFOSYS LTD) is also going to announce a simil...

Warren-mania

Image

BANK NIFTY - macro view

Image
BANKNIFTY (20877) - 21000 will become crucial for the macro point of view. if new uptrend emerges, then 23500 & ultimate 28400, but if it failed, then 17600 & ultimate 14600 In between the macro , so many micros will be part and parcel.

NIFTY vs NDTV

Image
NDTV  moving quite opposite of the market trend  (In the crowd, understand the underlying is important)

RELIANCE - after 7

Image
 It is moving up after 7 years... 

JINDALSTEL

Image
JINDALSTEL owners fund 18K Cr. vs 7K Cr. Market Cap || last 8 consecutive Qtrs cumulative loss 6.3K Cr. || still they have 11K Cr. to match — Murugavel (@murugavell) January 11, 2017  Market cap as of now at 9.8 K Cr.  ------------------------------------------- JINDALSTEL - 2 YEARS - MONTHLY 

Indian Mutual Fund industry’s Avg. Assets Under Management (AAUM) are at all time high ! - ₹ 17.83 Lakh Crore

Image
Average  Assets Under Management (AAUM) of Indian Mutual Fund Industry  for the month of January 2017 has crossed  ₹ 17.83 lakh crore, while the Assets Under Management (AUM)  as on January 31, 2017 stood at  ₹17.37 lakh crore The AUM of the Indian MF Industry has grown from ₹ 3.26 trillion as on 31st March 2007 to ₹ 17.83 trillion as on 31st January, 2017, a five-fold increase in a span of less than 10 years !! The MF Industry’s AUM has more doubled in the last 4 years from ₹ 5.87 trillion as on 31st March, 2012 to ₹ 12.33 trillion as on 31st March, 2016 The Industry’s AUM had crossed the milestone of  ₹10 Trillion  (₹10 Lakh Crore) for the first time in May 2014 and in a short span of two years and eight months, the AUM size has crossed ₹17.37 lakh crore last month. The total number of accounts (or folios as per mutual fund parlance) as on January 31, 2017 stood at 5.38 crore (53.8 million), while the number of folios under Equity, ...

LIVERMORE ERA & GRAHAM ERA

Image
Most of times, Stock Market has only two era based on the two legends' Psychology/Temperament /Attitude of  LIVERMORE & GRAHAM        In the last dozen years in Indian Stock Market, GRAHAM era worked out only in two periods ,  that was between the last quarter of 2008 to first quarter of 2009  (Oct. 2008 to March 2009)  and third quarter of 2011 to first quarter of 2014  (July 2011 to March 2014) and almost all other periods were/are belongs to LIVERMORE era  GRAHAM period era belongs to real investors LIVERMORE period era belongs to traders/positional traders.  When will be the next GRAHAM era going to starts ?  WAIT, patiently wait,  at present, that is the only answer.   below NIFTY monthly chart explains, how the the two legends era working out...
Image

Avenue Supermarts Ltd

Image
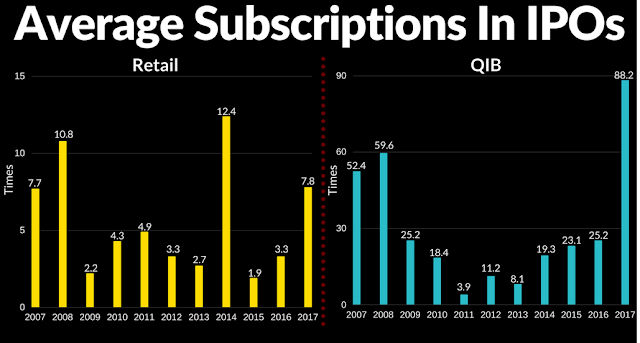
Avenue Supermarts Ltd. is all set to become the second initial public offering (IPO) to hit the primary markets in 2017. It is also being touted as the biggest IPO from the retail sector since 2007. The supermarket chain, founded and promoted by well-known investor Radhakishan Damani, plans to raise as much as Rs 1,870 crore from the primary market, by diluting 10 percent of its post-issue equity share capital, pegging its total market capitalisation at Rs 18,700 crore. . Detailed in BQ.  How D-Mart Stacks Up Against Peers

MSCI ACWI - now at "Make or Break" level

Image
MSCI ACWI  captures large and mid cap representation across 23 Developed Markets (DM) and 23 Emerging Markets (EM)  and has over $2.5 trillion in assets bench-marked to the MSCI World index family.          MSCI ACWI -  now re-test the previous high and at over bought zone. 

Today - India's Space Agency will attempt to send 104 Satellites into Orbit.

Image

APPLE

Image
APPLE ($133.29) -  Now target and resistance 139--147 but above that  ULTIMATE  UPSIDE TARGET 179-182. -------------------------- ​ Whenever APPLE reach $ 182 ​with the existing equity capital, that will be the memorable and historic day for the  stock market in the world,  because,  at that price, it will become a first One Trillion Dollar  market cap. company in the world.  ------------------------------------- --------------------------------------- About the Trillion Dollar :  Hoped in 21st Aug. 2012 post itself and the hope still continue...