Posts

Showing posts from April, 2017

ESCORTS vs JAYBARMARU

Image
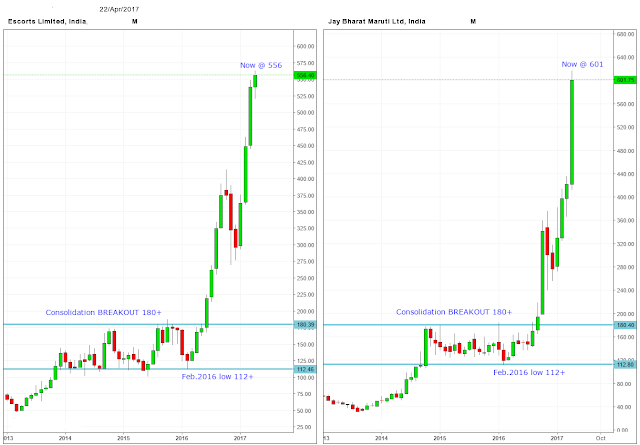
In 2015, ESCORTS & JAYBARMARU were traded at the same price of around 140--160. Fortunately, between 2015-2017, both stocks behaved exactly as for as price behaviour and time frame concerned.  even though both stocks were handled by the different set of people. That is why apart from everything,  "monitor the price movement and go on study the price behaviours because human behaviours never change even after  decades and decades" Either study yourself  or associate who studying it  for mutual benefit. I am ready, Are you?  ------------- Both  made same low 112+ in Feb.2016 Both breakout above 180+ Now  ESCORTS @ 550 & JAYBARMARU @ 600 ------------------------------ Below chart shows that how the both behaved identically in 2015--2017

Different games on different courts

Image
R ajiv  Khanna once said about the investment strategy, "It all depends on the underlying market condition. Like in tennis you play different games on different courts — hard court, clay court and lawn, we also study the market situation and pick our stocks accordingly. It can be either a value stock, growth stock, momentum stock or buying based on technicals." He feels the market is  the most complex puzzle, "It's not the money, it's the challenge what is exciting. Money is just the outcome. And once you start to understand the game, making money is not difficult," he said. *** QTY NAME in Cr. 10208675 MANAPPURAM 96 238000 NILKAMAL 47 3354046 NOCIL 33 426955 IFBIND 29 636313 SRIPIPES 25 477986 RSWM 20 2957280 DAAWAT 19 267108 TATAMETALI 18 180878 TIRUMALCHM 16 274371 DWARKESH 12 317702 ASIANTILES

Sanwaria Agro Oils Ltd

Image
Sanwaria Agro first came into the spotlight in 2011 when brokerage and financial services firm Motilal Oswal ranked it alongside Reliance Industries and Kotak Mahindra Bank as one of the fastest wealth creators between 2006 and 2011.   (As reported in BUSINESS TODAY - Edition : Dec 22, 2013 ) What happened afterwards?  In 2011, it was peaked out at 146,  In 2016, It was bottomed out at 4 And now trading at 12+ (this month alone, so for, up by more than 50%) *** Now, what price & pattern says?  Last year bottom formed at 4  and now broken last three years high of 12.50 Is it in revival stage now? if so, long way to go...

The Power Break

Image
(name and price purposely erased)  **** Rs.10 Paid up || Low equity || zero debt || || consistently profit making & dividend paying company || || current price is double the book value ||  || TTM EPS  more than 6 times of the paid up value || *** Ought to triple, from the current price.  Let us see. 

WEALTH CREATED then WEALTH DESTRUCTED and now once again....

Image
ITDC (469) -  Between 2012-2013 Artificially wealth created and in the same way wealth destructed. From  Jan 2014 onwards, it is in the reality mode.  from 2013 high, it came down to 97% and  now from 2014 low it moved up to 700 %  (as of now) All these things happened within 5 years.  *** How much can move from here?

Sailing now , expect multiple

Image
An act of beginning a voyage (name & price purposely erased) 

FY 2016-17 - LOSERS - more than 25% to 80% - 64 Stocks

Image
 LOSERS ORDER  %    LOSERS in ALPHAPET  %  ESSDEE -83.45%   ADSL -27.35% GLOBOFFS -76.36%   AXISCADES -43.97% TREEHOUSE -75.08%   BAJAJHIND -33.25% MBLINFRA -70.44%   BLUEBLENDS -44.81% PRATIBHA -66.93%   CNOVAPETRO -27.81% PTL -65.39%   DENORA -28.13% GTOFFSHORE -63.08%   DIGJAMLTD -25.00% LAMBODHARA -55.34%   DIVISLAB -36.81% JMTAUTOLTD -54.92%   ELAND -41.51% STAMPEDE -54.34%   ENERGYDEV -52.45% ENERGYDEV -52.45%   ESSDEE -83.45% SABEVENTS -50.94%   GET&D -25.13% ZICOM -50.66%   GLAXO -28.05% NOIDATOLL -49.78%   GLOBOFFS -76.36% MTEDUCARE -49.19%   GMBREW -48.97% INTELLECT -49.08%   GTOFFSHORE -63.08% GMBREW -48.97%   HINDSYNTEX -27.40% P

FY 2016-17 - GAINERS - more than 50% to 900% - 525 Stocks

Image
 GAINERS in % GAINERS in ALPHAPET PRIMESECU 898.55% A2ZINFRA 118.09% MANAKINDST 829.31% ABIRLANUVO 84.59% IMFA 594.94% ACCELYA 67.42% JAYAGROGN 579.17% ACE 54.39% PILITA 523.20% ADANITRANS 86.75% TATAMETALI 505.47% ADFFOODS 106.37% JSLHISAR 437.24% ADVENZYMES 74.81% STARPAPER 408.32% AEGISCHEM 100.72% SHREYANIND 393.57% AGARIND 382.63% TIRUMALCHM 390.89% AGRITECH 329.78% AGARIND 382.63% AIAENG 68.96% GOLDINFRA 352.25% AIFL 56.45% CREST 336.88% AKSHOPTFBR 62.84% AGRITECH 329.78% ALICON 61.43% SHILPI 325.78% ALKALI 87.32% JSL 325.07% ALKEM 62.55% MAANALU 314.66% ALLSEC 225.88%